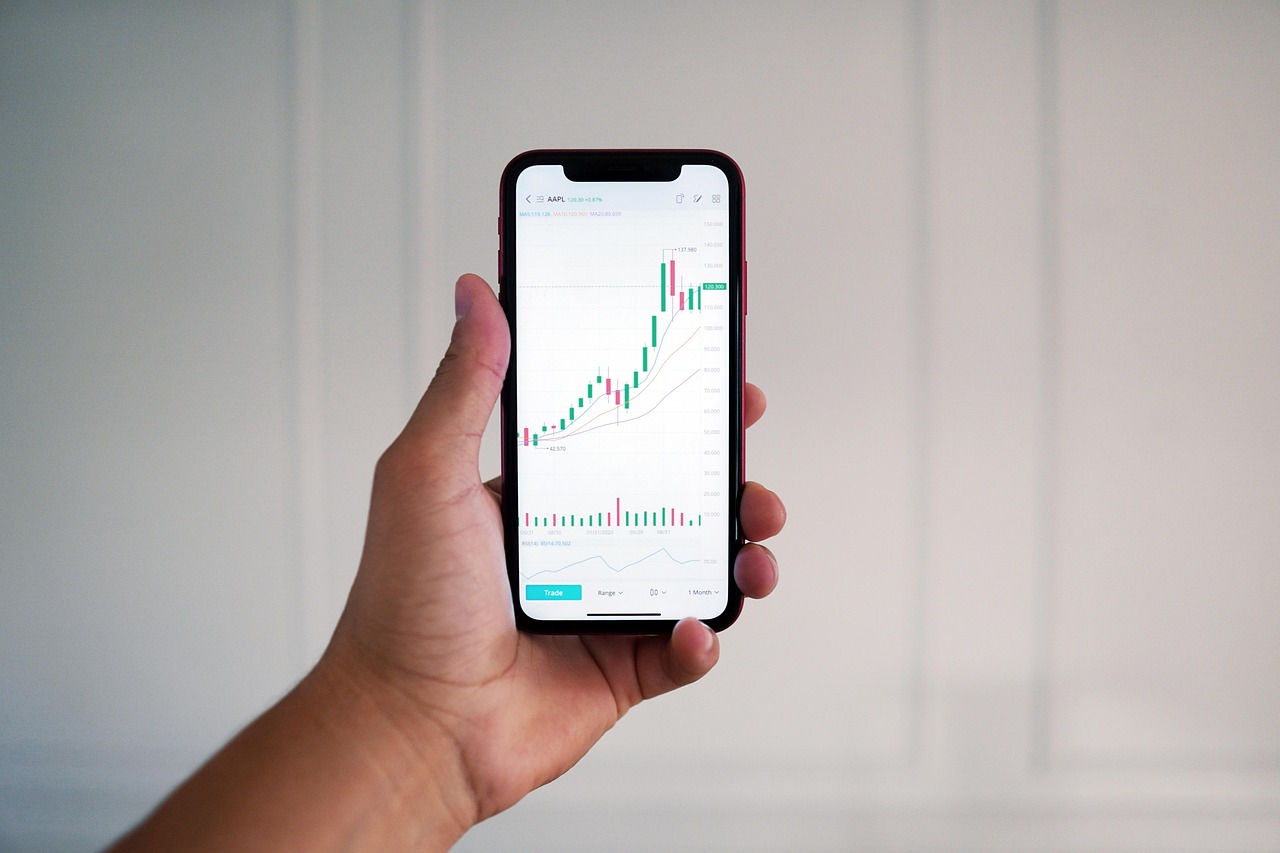
In the dynamic world of trading and investment, where fortunes can be made or lost in the blink of an eye, having a robust strategy is paramount. But how do you know if your meticulously crafted trading system truly holds water before you commit real capital? This is where backtesting emerges as the quintessential secret weapon for savvy investors and algorithmic traders alike. It’s the ultimate time machine for your financial models, allowing you to rewind the clock and test your investment hypotheses against the unforgiving reality of historical market data. Without this critical step, even the most brilliant trading ideas remain mere speculation, prone to costly real-world failures. Let’s delve deep into the world of backtesting to unlock its power and learn how to wield it effectively.
What is Backtesting? The Foundation of Strategy Validation
At its core, backtesting is the process of applying a trading strategy or analytical method to historical data to determine its effectiveness. Think of it as a simulation, but with real past market conditions. By running your strategy on data from weeks, months, or even years ago, you can observe how it would have performed, identifying its strengths and weaknesses without risking a single dollar of live capital.
Defining Backtesting
-
Historical Data Application: A strategy’s rules (entry, exit, position sizing) are applied to past market data points (prices, volumes, indicators).
-
Performance Measurement: The backtesting engine calculates the hypothetical trades and their outcomes, generating a detailed performance report.
-
Analogy: Imagine building a new car engine. You wouldn’t put it directly into a race car without extensive testing in a lab and on a test track. Backtesting is that test track for your financial strategies.
Why is Backtesting Crucial for Financial Models?
Backtesting isn’t just a good idea; it’s a non-negotiable step for anyone serious about systematic trading or investment. Its importance stems from several key benefits:
-
Strategy Validation: It provides empirical evidence of whether your strategy generates positive returns under various market conditions, validating your investment thesis.
-
Risk Identification: Uncovers potential flaws, significant drawdowns, and periods of underperformance, allowing you to mitigate risks before live deployment.
-
Confidence Building: A well-executed backtest instills confidence in your strategy, reducing emotional decision-making when real money is on the line.
-
Parameter Optimization: Helps in fine-tuning strategy parameters to enhance profitability and reduce risk, though caution is needed to avoid overfitting.
-
Cost-Effective Learning: Allows for rapid iteration and experimentation with different ideas without incurring real trading costs or losses.
Actionable Takeaway: Never deploy a trading strategy without rigorously backtesting it first. It’s your primary defense against unforeseen market shocks and a cornerstone of effective algorithmic trading development.
The Core Components of Effective Backtesting
For a backtest to be meaningful and yield reliable insights, several key components must be handled with precision and care. Neglecting any of these can lead to misleading results and false confidence.
Quality Historical Data
The adage “garbage in, garbage out” holds especially true for backtesting. The quality and integrity of your historical data are paramount.
-
Accuracy and Completeness: Data should be free from errors, missing values, and distortions. Ensure it includes all relevant price points (open, high, low, close), volume, and potentially other indicators or fundamental data.
-
Data Sources: Reputable data vendors, brokerage platforms, and financial APIs (e.g., Yahoo Finance, Quandl, Bloomberg, Refinitiv) are common sources. Be wary of free, unchecked data sources.
-
Data Granularity: Choose the appropriate time frame (tick data, 1-minute, 5-minute, daily, weekly) based on your strategy’s frequency. High-frequency strategies demand tick data, while swing trading might only need daily data.
-
Adjustments: Ensure data accounts for corporate actions like stock splits, dividends, and mergers to avoid artificial price gaps.
Strategy Rules and Parameters
Your strategy needs to be clearly defined and executable by the backtesting engine.
-
Unambiguous Entry/Exit Conditions: Precise rules for when to buy, sell, or hold. For example, “Buy when the 50-period Simple Moving Average (SMA) crosses above the 200-period SMA.”
-
Risk Management: Define stop-loss levels, take-profit targets, and position sizing rules. This is crucial for realistic risk management.
-
Parameter Values: Specify all numerical parameters used in your strategy (e.g., the periods for moving averages, the threshold for an RSI indicator).
Practical Example: A simple moving average crossover strategy might have parameters like: short_period = 20, long_period = 50, stop_loss_percentage = 2%, take_profit_percentage = 5%.
Backtesting Software and Platforms
Tools automate the process of applying strategy rules to data and generating reports.
-
Dedicated Platforms: MetaTrader (MT4/MT5), TradingView (Pine Script), QuantConnect, Backtrader (Python library), Amibroker, NinjaTrader are popular choices.
-
Programming Languages: Python (with libraries like Pandas, NumPy, and specific backtesting frameworks like `backtrader` or `zipline`) offers ultimate flexibility for custom strategies and advanced data analysis.
-
Features: Look for platforms that support multiple asset classes, offer robust reporting, allow for custom indicator development, and handle real-world factors like transaction costs and slippage.
Actionable Takeaway: Invest in high-quality historical data and choose a backtesting platform or language that aligns with your technical skills and strategy complexity. A clear, well-defined strategy is the backbone of any successful backtest.
The Backtesting Process: A Step-by-Step Guide
Executing a comprehensive backtest involves more than just pressing a button. It’s a systematic approach that moves from idea generation to iterative refinement.
Step 1: Formulate Your Strategy
This is where your investment idea takes shape. It could be based on technical indicators, fundamental analysis, macroeconomic events, or a combination thereof.
-
Idea Generation: Develop a clear hypothesis. For instance, “I believe stocks tend to rebound after a significant short-term dip, specifically when the price falls below its 20-day moving average and the RSI is oversold.”
-
Define Rules: Translate your hypothesis into precise, measurable, and objective entry and exit rules. Every condition must be quantifiable.
- Entry Condition: Buy when Asset X’s Close Price < 20-day SMA AND RSI(14) < 30.
- Exit Condition (Profit): Sell when Asset X’s Close Price > Entry Price + 3% OR RSI(14) > 70.
- Exit Condition (Loss): Sell when Asset X’s Close Price < Entry Price – 1%.
- Position Sizing: Allocate 1% of total capital per trade.
Step 2: Acquire and Prepare Data
With your strategy defined, gather the necessary historical data and clean it.
-
Data Collection: Download or access historical price data (OHLCV – Open, High, Low, Close, Volume) for the relevant assets and timeframes over a significant period (e.g., 5-10 years for daily data).
-
Data Cleansing: Address missing data points, remove erroneous entries, and adjust for corporate actions. Ensure consistency in time zones and currency.
-
Feature Engineering (Optional): Calculate any custom indicators or features your strategy relies on (e.g., moving averages, RSI, MACD). Many backtesting platforms do this automatically.
Step 3: Execute the Backtest
Feed your prepared data and strategy rules into your chosen backtesting software or script.
-
Define Test Period: Specify the start and end dates for your backtest. It’s good practice to use an “in-sample” period for development and an “out-of-sample” period for final validation.
-
Configure Parameters: Input any specific parameters your strategy uses (e.g., lookback periods for indicators, slippage percentages, commission rates).
-
Run Simulation: Let the software run the historical simulation, generating hypothetical trades according to your rules.
Step 4: Analyze Results and Refine
The core of backtesting lies in interpreting the results and using them to improve your strategy.
-
Performance Metrics: Examine key performance indicators (detailed in the next section) such as cumulative returns, maximum drawdown, Sharpe Ratio, Sortino Ratio, profit factor, and win rate.
-
Visual Analysis: Plotting the equity curve is crucial. A smooth, upward-sloping curve is ideal, while erratic or downward trends signal issues.
-
Identify Weaknesses: Pinpoint periods of poor performance, significant drawdowns, or unexpected behavior. Ask “why” these occurred.
-
Iterative Refinement: Based on the analysis, adjust your strategy rules or parameters. This is an iterative process, but beware of overfitting (see next section).
Actionable Takeaway: Approach backtesting systematically, from clear strategy definition to meticulous data handling and careful result analysis. Focus on understanding “why” your strategy performs a certain way, not just “how much” it makes.
Common Pitfalls and Best Practices in Backtesting
While powerful, backtesting is not without its traps. Understanding and avoiding common pitfalls is crucial for generating truly reliable insights from your strategy validation efforts.
Pitfalls to Avoid in Backtesting
-
Overfitting: This is arguably the biggest danger. Overfitting occurs when a strategy is too finely tuned to the historical data it was developed on, performing exceptionally well in the backtest but failing miserably in live trading. It’s like tailoring a suit perfectly to a mannequin, only for it not to fit a real person.
- Example: Optimizing indicator parameters to achieve peak performance on a specific historical period, only for those exact parameters to fail as market conditions change.
-
Look-ahead Bias: Using information in your backtest that would not have been available at the time of the trade. This artificially inflates performance.
- Example: Using the closing price of a day to make a trading decision that would have had to be executed during that same day. Or using future fundamental data that hasn’t been released yet.
-
Survivorship Bias: Ignoring data from assets (e.g., stocks) that have been delisted or are no longer trading. If your backtest only includes currently active stocks, it might show artificially better performance because it excludes all the “losers” that went out of business.
- Example: Backtesting a stock portfolio strategy using only companies currently in the S&P 500 without including those that dropped out or were acquired.
-
Neglecting Transaction Costs & Slippage: Many basic backtests assume perfect execution and zero costs. In reality, commissions, fees, and slippage (the difference between the expected price of a trade and the price at which the trade is actually executed) can significantly erode profits.
- Example: A strategy with many small, frequent trades might look highly profitable without accounting for each transaction’s cost, which could easily wipe out all gains.
-
Insufficient Data or Poor Data Quality: Testing on too short a period or using inaccurate data leads to unreliable results. A short period might not capture various market regimes (bull, bear, choppy).
- Example: Backtesting a long-term investment strategy using only 1 year of data, missing out on crucial bear market cycles.
Best Practices for Robust Backtesting
To overcome these pitfalls and create more reliable backtests, consider these practices:
-
Out-of-Sample Testing: Develop and optimize your strategy on one segment of historical data (in-sample data), then test its performance on a completely different, unseen segment (out-of-sample data). This helps gauge its generalization ability and detect overfitting.
-
Walk-Forward Optimization: Periodically re-optimize strategy parameters using only the most recent data, then test those new parameters on the immediate subsequent data. This mimics how an adaptive live trading system would operate.
-
Robustness Testing: After optimizing, slightly vary the optimal parameters (e.g., increase/decrease a moving average period by 5-10%). If the strategy’s performance remains stable, it’s more robust; if performance drastically drops, it might be overfitted.
-
Realistic Assumptions: Always include realistic estimates for commissions, slippage, and even market impact (especially for large trades). Be conservative with these estimates.
-
Multiple Market Regimes: Ensure your backtest period covers diverse market conditions – bull markets, bear markets, sideways markets, high volatility, low volatility – to assess adaptability.
-
Stress Testing: Test your strategy against extreme historical events (e.g., 2008 financial crisis, Dot-com bubble, COVID-19 crash) to understand its worst-case scenario performance.
Actionable Takeaway: Be a skeptical backtester. Always challenge your results and actively work to uncover potential biases. Robust backtesting is about proving your strategy isn’t just luck, not just finding a good-looking equity curve.
Beyond the Numbers: Interpreting Backtest Results
A backtest generates a plethora of statistics, but understanding what these numbers truly mean for your financial models is key to effective decision-making and risk management. It’s not just about the total profit.
Understanding Key Performance Metrics
Beyond raw profit, these metrics provide a comprehensive view of your strategy’s performance and risk profile:
-
Cumulative Return / Compound Annual Growth Rate (CAGR): Measures the total percentage gain over the backtest period and the annualized growth rate. This tells you how much your capital hypothetically grew.
-
Maximum Drawdown: The largest peak-to-trough decline in the equity curve during the backtest. It’s a critical measure of potential capital at risk and volatility. A strategy with high returns but also high drawdown might be too risky.
-
Sharpe Ratio: Measures the risk-adjusted return. It quantifies how much excess return you received for the extra volatility you endured. A higher Sharpe Ratio is better, indicating more return per unit of risk.
- Formula Idea: (Strategy Return – Risk-Free Rate) / Standard Deviation of Strategy Returns
-
Sortino Ratio: Similar to the Sharpe Ratio, but it only considers downside volatility (standard deviation of negative returns). This is often preferred by traders who are less concerned with upside volatility. A higher Sortino Ratio is better.
-
Profit Factor: Gross Profit / Gross Loss. A profit factor greater than 1.0 indicates a profitable strategy. A value of 2.0 means your gross profits were twice your gross losses.
-
Win Rate: The percentage of winning trades out of total trades. A high win rate can be deceptive if the losing trades are very large.
-
Average Win/Loss: The average profit from winning trades vs. the average loss from losing trades. This helps evaluate the strategy’s reward-to-risk ratio.
Practical Example:
Equity Curve: Smooth, consistent upward trend
CAGR: 18%
Max Drawdown: 12%
Sharpe Ratio: 1.5
Sortino Ratio: 2.1
Profit Factor: 1.8
Win Rate: 55%
Average Win: 1.5% | Average Loss: -1.0%
Interpretation: This strategy generated decent annualized returns with manageable drawdowns and good risk-adjusted returns (Sharpe/Sortino > 1.0 is generally good). The profit factor and average win/loss suggest winners are larger than losers, which is healthy even with a modest win rate.
Statistical Significance and Confidence
Is the performance you’re seeing in your backtest truly robust, or could it be due to chance?
-
Number of Trades: Strategies with very few trades might have statistically insignificant results. A larger number of trades provides more confidence in the observed performance.
-
Time Horizon: Backtesting over a longer period, encompassing different market cycles, increases confidence in the strategy’s adaptability.
-
Randomness: Even with a positive backtest, understand that past performance is not indicative of future results. Markets evolve, and randomness is always a factor.
The Human Element in Strategy Development
Backtesting is a powerful tool, but it’s not a magic bullet or a crystal ball. It requires human judgment and continuous oversight.
-
Context is Key: Understand the market conditions during your backtest period. Would your strategy still perform in today’s environment?
-
Continuous Monitoring: Even after a successful backtest and live deployment, continuous monitoring and periodic re-evaluation are essential. Strategies can degrade over time.
-
Adaptability: The most successful traders and investors are those who can adapt their strategies as market dynamics change, using backtesting as a foundational feedback loop rather than a rigid rulebook.
Actionable Takeaway: Go beyond raw profit. Use a comprehensive set of metrics to evaluate your strategy’s risk, consistency, and efficiency. Remember that backtesting informs, but doesn’t guarantee future success.
Conclusion
In the high-stakes arena of financial markets, backtesting stands as an indispensable discipline for validating trading strategies and mitigating risk. It empowers traders, investors, and quantitative analysts to rigorously test their hypotheses against the vast tapestry of historical data, transforming speculative ideas into data-driven confidence. From carefully acquiring quality data and defining unambiguous strategy rules to navigating the treacherous waters of overfitting and look-ahead bias, each step in the backtesting process demands meticulous attention to detail.
By embracing best practices such as out-of-sample testing, realistic cost assumptions, and a deep understanding of performance metrics, you can elevate your financial models from theoretical constructs to potentially profitable tools. While no backtest can perfectly predict the future, a well-executed and thoughtfully interpreted backtest significantly enhances your preparedness for live market conditions, reduces emotional decision-making, and serves as a crucial feedback loop for continuous improvement in your journey towards systematic and successful trading.