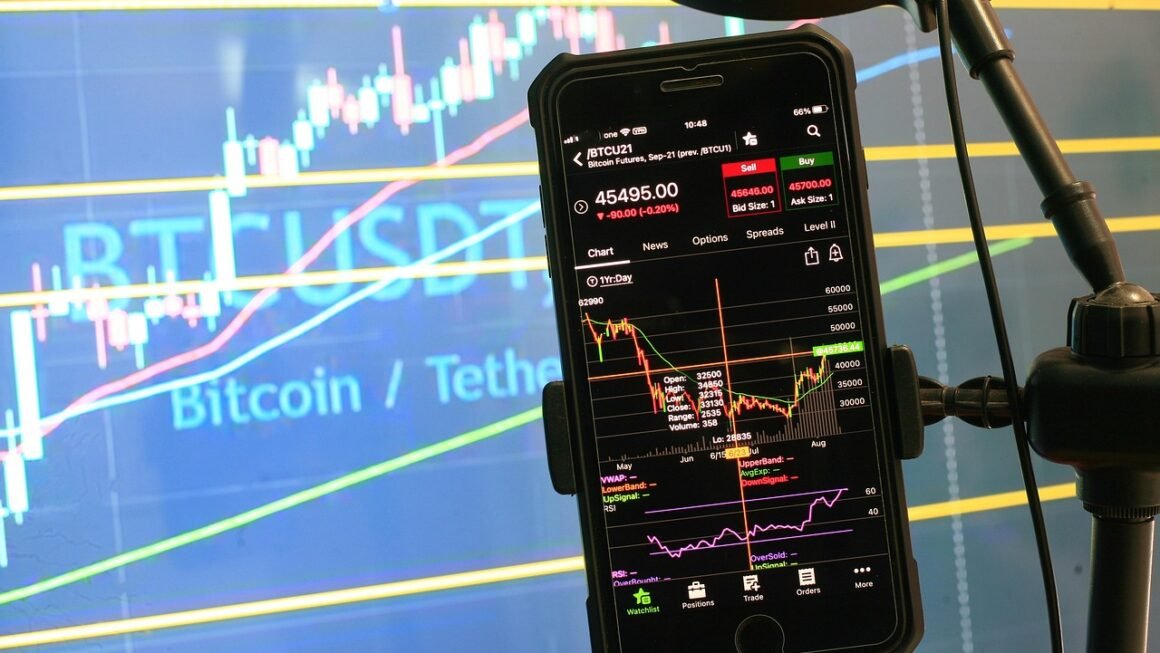
In the rapidly evolving world of cryptocurrencies and blockchain technology, making informed decisions can feel like navigating a dense fog. Traditional market analysis, while valuable, often falls short of capturing the true dynamics of these decentralized networks. This is where on-chain analytics emerges as a powerful lighthouse, cutting through the opacity to reveal the fundamental truth of network activity, user behavior, and asset flows directly from the blockchain itself. By dissecting immutable, publicly available data, on-chain analytics empowers investors, traders, and enthusiasts with unprecedented insights, transforming speculation into data-driven strategy.
What is On-Chain Analytics? The Foundation of Transparency
On-chain analytics is the process of examining and interpreting data recorded directly on a blockchain. Unlike traditional financial markets where much of the underlying data is proprietary or aggregated, blockchain provides a transparent, immutable ledger where every transaction, every smart contract interaction, and every wallet address change is publicly visible and verifiable.
Defining On-Chain Data
On-chain data refers to all the information that is permanently stored and accessible on a blockchain. This includes:
- Transaction Details: Sender and receiver addresses, transaction amounts, timestamps, transaction fees, and block numbers.
- Wallet Addresses: Balances held, history of transactions, and the number of unique wallets interacting with a network.
- Smart Contract Interactions: Data related to Decentralized Finance (DeFi) protocols, Non-Fungible Tokens (NFTs), Decentralized Autonomous Organizations (DAOs), including deposits, withdrawals, token swaps, and minting events.
- Network Health Metrics: Hash rate, mining difficulty, block time, and overall network security.
Practical Example: When you send Bitcoin from one wallet to another, that transaction is recorded on the Bitcoin blockchain. On-chain analytics can track that specific transaction, see its value, its timestamp, and even identify the sender and receiver addresses (though not necessarily their real-world identities without further linkage). This granular data forms the basis for sophisticated analysis.
Why It Matters
The significance of on-chain data lies in its unparalleled transparency and immutability. It offers a single source of truth that cannot be manipulated or falsified. This direct access to raw data provides several advantages:
- Unfiltered Insights: See genuine network activity, not just price action influenced by speculation or news.
- Early Signal Detection: Often, fundamental shifts in network usage or large institutional movements precede significant price changes.
- Reduced Information Asymmetry: Levels the playing field by making critical data accessible to everyone, not just institutional players.
- Enhanced Due Diligence: Evaluate the real adoption and utility of a blockchain project, rather than relying solely on whitepapers or marketing.
Actionable Takeaway: Recognize that every interaction on a public blockchain leaves an analyzable footprint. Mastering the ability to interpret this data provides a significant edge in understanding the underlying economics and sentiment of the crypto market.
Key Metrics and How to Interpret Them
Understanding on-chain analytics requires familiarity with a range of key metrics. These metrics can be broadly categorized to provide a holistic view of network health, user behavior, and market sentiment.
Transactional Metrics
These metrics focus on the activity occurring on the network’s ledger.
- Active Addresses: The number of unique wallet addresses that were active (either sending or receiving) on a given day.
- Interpretation: A rising number suggests increasing network adoption and usage, often a bullish signal. A declining number can indicate waning interest or utility. For instance, a surge in active addresses for a specific DeFi protocol could signal growing engagement and potential for its native token.
- Transaction Count/Volume: The total number of transactions processed and the aggregate value transferred within a specific period.
- Interpretation: High transaction counts and volumes signify robust network utility and economic activity. A discrepancy where transaction count rises but volume stagnates might suggest increased small retail transactions without significant institutional movement.
- Average Transaction Value: The total transaction volume divided by the total transaction count.
- Interpretation: Helps distinguish between retail and institutional activity. A sudden spike might indicate large “whale” transfers, while consistently lower values could point to widespread retail adoption.
Holder Behavior Metrics
These metrics offer insights into the actions and sentiment of market participants.
- Wallet Distribution / Whale Movements: Analyzing the concentration of tokens across different wallet sizes (e.g., how many wallets hold over 1,000 BTC).
- Interpretation: Identifying “whales” (large holders) and tracking their accumulation or distribution patterns can predict potential market movements. For example, a significant transfer of Bitcoin from whale wallets to exchanges might signal an impending sell-off.
- Exchange Inflows/Outflows: The amount of cryptocurrency moving onto or off of centralized exchanges.
- Interpretation: High exchange inflows often indicate an intent to sell, potentially increasing selling pressure. Conversely, high outflows suggest accumulation or movement to cold storage, signaling bullish sentiment or long-term holding.
- HODL Waves / Investor Age: Visualizes the supply of a cryptocurrency based on how long coins have been held unmoved.
- Interpretation: Reveals the conviction of long-term holders. An increasing proportion of older coins remaining unmoved suggests strong holding sentiment, while old coins suddenly becoming active might indicate profit-taking or capitulation. The Spent Output Profit Ratio (SOPR) is another related metric, showing if investors are selling at a profit or a loss.
Network Health & Security Metrics
These metrics pertain to the underlying security and decentralization of the blockchain.
- Hash Rate: The total computational power used to mine and process transactions on a Proof-of-Work blockchain (e.g., Bitcoin).
- Interpretation: A higher hash rate indicates greater network security and miner confidence, making it harder for malicious actors to attack the network. Declining hash rates can signal reduced profitability for miners or concerns about the network.
- Difficulty Adjustment: The automatic recalibration of how hard it is to mine a block, ensuring consistent block times.
- Interpretation: Reflects the growth or decline in mining power and interest. Rising difficulty indicates more miners are joining the network, competing for rewards, and increasing security.
Actionable Takeaway: Don’t look at metrics in isolation. Combine different data points to build a comprehensive narrative. For instance, increasing active addresses and decreasing exchange reserves for an asset paint a much clearer bullish picture than either metric alone.
Practical Applications Across the Crypto Ecosystem
The insights derived from on-chain analytics are not merely academic; they have direct, tangible applications for various participants in the crypto space, from individual investors to institutional funds.
Market Trend Prediction and Investment Strategy
On-chain data provides powerful signals that can inform trading and investment decisions, often preempting price movements.
- Spotting Accumulation/Distribution Zones:
- When exchange outflows are high and active addresses are increasing, it often signals an accumulation phase by informed investors, suggesting future price appreciation.
- Conversely, high exchange inflows coupled with a spike in SOPR (meaning many are selling at a profit) could signal a local top and potential distribution.
- Identifying “Smart Money” Movements: Tracking the activity of large, sophisticated investors (“whales”) can provide clues about future market direction. If a significant number of long-term holders start moving their assets to exchanges, it’s a strong signal to pay attention.
- Risk Management: By monitoring metrics like stablecoin flows to exchanges, investors can gauge the amount of “dry powder” ready to enter the market, indicating potential buying pressure.
Practical Example: Before a major Bitcoin bull run, analysts might observe a consistent trend of Bitcoin moving off exchanges into private wallets (cold storage), alongside a steady increase in the number of unique active addresses. This suggests increasing demand and a long-term holding sentiment, providing a strong fundamental basis for an uptrend.
DeFi and NFT Insights
On-chain analytics is indispensable for understanding the nuances of the decentralized finance and NFT sectors.
- DeFi Health and Adoption:
- Total Value Locked (TVL): Measures the total amount of assets staked in a DeFi protocol, indicating its capital base and trust.
- Unique Users/Transactions: Reveals actual adoption and usage of a DApp. A high TVL but low unique users might indicate whale concentration rather than widespread adoption.
- Gas Fee Trends: High gas fees on Ethereum often signify high demand for network usage, impacting DApp profitability and user experience.
- Stablecoin Dominance: Changes in the market cap and velocity of stablecoins can indicate liquidity entering or leaving the broader crypto market, often impacting DeFi.
- NFT Market Analysis:
- Floor Prices and Volume: Tracking these for specific collections gives real-time market sentiment.
- Unique Buyers/Sellers: High unique buyers entering a collection can signal growing interest, while a decrease might indicate cooling demand.
- Whale Activity: Monitoring wallets that hold valuable NFTs can reveal accumulation or liquidation patterns in the high-value segment.
- Holding Periods: Analyzing how long NFTs are held can indicate speculative flipping vs. long-term collecting.
Practical Example: When a new NFT collection launches, on-chain data can immediately show the number of unique wallets minting, the average price paid, and the speed at which the collection sells out. Post-mint, you can track the number of secondary sales, the unique buyers, and even identify wallets that are rapidly flipping NFTs versus those holding for longer terms, painting a clear picture of market sentiment and collection health.
Security and Fraud Detection
The transparent nature of blockchain data makes it a powerful tool for security analysis and forensic investigations.
- Tracing Stolen Funds: In the event of a hack or theft, on-chain analysts can follow the trail of stolen funds across different wallets and exchanges, aiding law enforcement and recovery efforts.
- Identifying Illicit Activities: Patterns of transactions can sometimes reveal money laundering, scam operations, or sanction evasion, as funds move through mixers or multiple addresses.
- Smart Contract Vulnerability Monitoring: Tools can monitor interactions with smart contracts for unusual activity, large outflows, or exploits in real-time.
Actionable Takeaway: Incorporate on-chain metrics into your personal due diligence for investments. Before investing in a DeFi protocol or NFT collection, review its TVL, user growth, and whale activity. For market timing, observe exchange flows and active addresses for your chosen assets.
Tools and Platforms for On-Chain Analysis
Accessing and interpreting the vast amounts of on-chain data requires specialized tools and platforms. These range from basic block explorers to sophisticated analytical dashboards.
Explorer Tools
These are the foundational tools for anyone diving into on-chain data. They allow you to view individual transactions, wallet balances, and block information for specific blockchains.
- Etherscan (Ethereum): The most widely used explorer for Ethereum and its ERC-20 tokens, providing detailed transaction, block, and smart contract information.
- Blockchain.com (Bitcoin): A popular explorer for Bitcoin, offering insights into blocks, transactions, and addresses.
- Solscan (Solana): Similar functionality for the Solana blockchain.
- BscScan (Binance Smart Chain): For the Binance Smart Chain.
Use Case: You received a transaction and want to verify its status and details. You can simply paste the transaction hash into the respective block explorer to see its confirmation status, sender/receiver, and value.
Dedicated On-Chain Analytics Platforms
These platforms aggregate, visualize, and provide advanced metrics and tools for in-depth analysis, often requiring a subscription for full access.
- Glassnode: Renowned for its comprehensive suite of Bitcoin and Ethereum on-chain metrics, offering detailed charts, dashboards, and advanced indicators like SOPR and MVRV (Market-Value-to-Realized-Value Ratio).
- CryptoQuant: Provides a wide array of on-chain data, particularly strong in exchange flow metrics, derivatives market data, and miner activity.
- Nansen AI: Specializes in “smart money” tracking, identifying notable wallet addresses (e.g., DeFi whales, NFT collectors, fund addresses) and their movements across various chains, offering excellent insights into NFTs and DeFi.
- Dune Analytics: A powerful, community-driven platform that allows users to write custom SQL queries to analyze on-chain data from various blockchains (Ethereum, Polygon, Solana, etc.) and visualize it in dashboards. It’s often free for public dashboards and a favorite for niche DeFi/NFT analysis.
- Santiment: Offers on-chain, social, and development metrics, focusing on crowd sentiment and fundamental project health.
Use Case: An investor wants to analyze the accumulation patterns of Bitcoin by large entities. They would use platforms like Glassnode or CryptoQuant to monitor whale addresses, exchange net flows, and HODL waves to identify potential accumulation zones.
Data Aggregators and APIs
For developers and advanced users, direct data access via APIs or through aggregators allows for custom analysis and integration into other applications.
- Messari: Provides a wide range of crypto data, including some on-chain metrics, research reports, and APIs.
- The Graph: A decentralized indexing protocol that allows dApps and developers to query blockchain data efficiently, often used for specific DeFi protocols.
Actionable Takeaway: Start with free block explorers to get comfortable with raw data. As your analytical needs grow, explore free tiers or public dashboards on platforms like Dune Analytics, and then consider paid subscriptions to Glassnode or Nansen for more advanced and proprietary insights into on-chain analytics.
The Future of On-Chain Analytics and Its Challenges
On-chain analytics is a rapidly evolving field, continuously pushing the boundaries of what’s possible in understanding decentralized networks. However, it also faces significant challenges that will shape its future development.
Evolving Sophistication
The future of on-chain analytics promises even deeper and more integrated insights:
- AI and Machine Learning Integration: Expect more sophisticated AI/ML models to identify subtle patterns, predict market movements with greater accuracy, and detect anomalies indicative of fraud or market manipulation.
- Cross-Chain Analysis: As the multi-chain ecosystem grows, tools will increasingly integrate data from disparate blockchains (e.g., Ethereum, Solana, Polkadot) to provide a holistic view of capital flows and user activity across the entire crypto landscape.
- Identity Solutions: While maintaining pseudonymity, future solutions might offer better ways to link on-chain addresses to verified entities (with user consent), enabling more nuanced institutional analysis and compliance without sacrificing privacy for the average user.
- Real-time Predictive Models: Moving beyond retrospective analysis, real-time predictive models will become more common, offering actionable alerts and insights for high-frequency trading and risk management.
Privacy Concerns and Solutions
The very transparency that makes on-chain analytics powerful also poses privacy challenges for users.
- The Privacy Paradox: As analytical tools become more advanced, the ability to de-anonymize transactions and identify entities behind wallet addresses increases, raising concerns for individual privacy.
- Emergence of Privacy-Enhancing Technologies: Solutions like Zero-Knowledge Rollups (ZK-rollups), privacy coins (Monero, Zcash), and coin mixing services are gaining traction. These technologies aim to obfuscate transaction details or sender/receiver information, presenting a challenge for traditional on-chain surveillance.
- Balancing Transparency and Privacy: The industry will need to navigate the tension between the need for transparency (for audits, security, and market analysis) and the fundamental right to financial privacy.
Data Overload and Interpretation Challenges
The sheer volume and complexity of on-chain data present ongoing hurdles.
- Information Overload: As more data becomes available, sifting through it to find genuinely actionable insights becomes increasingly difficult, requiring more advanced filtering and visualization tools.
- Avoiding Misinterpretation: Drawing incorrect conclusions from on-chain data is a significant risk. For example, a large transfer from one exchange to another might look like an outflow but could just be an internal rebalancing. Context and multi-metric analysis are crucial.
- Confirmation Bias: Analysts must be careful not to cherry-pick data that confirms their existing biases. A rigorous, objective approach is essential.
- Evolving Blockchain Architectures: New blockchain designs (e.g., sharding, layer 2 solutions) can make unified data collection and analysis more complex across different layers and chains.
Actionable Takeaway: Stay informed about new tools and methodologies in on-chain analytics. Always approach data with a critical mindset, cross-referencing insights with other market data and news. Embrace the learning curve, as the field is constantly evolving.
Conclusion
On-chain analytics has undeniably revolutionized how we understand and interact with the crypto market. By providing direct, immutable insights into the fundamental activity of blockchain networks, it empowers users with unparalleled transparency and a data-driven edge that traditional analysis simply cannot match. From predicting market trends and optimizing investment strategies to enhancing security and delving into the intricacies of DeFi and NFTs, the applications are vast and continuously expanding.
While challenges such as privacy concerns and data interpretation complexities remain, the future of on-chain analytics is bright, promising even more sophisticated tools and integrated insights. For anyone serious about navigating the crypto landscape, embracing on-chain analytics is no longer an option but a necessity. It is the key to unlocking the true potential of decentralized finance and making truly informed decisions in this dynamic and exciting new economy.